Fig. 7
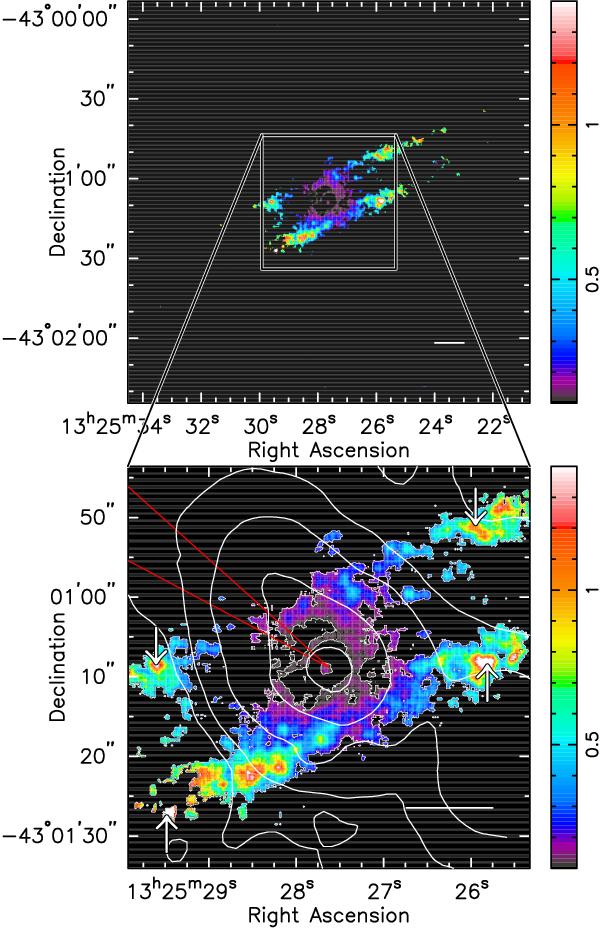
3.3 μm PAH feature to continuum ratio emission from Cen A, derived from the images shown in Figs. 1 and 6. The bar in the lower right corner of each panel illustrates 200 pc at the distance to Cen A. The wedges to the right indicate the values of the ratio. The bottom panel shows a blowup of the central region to better illustrate details. The arrows in that panel are at the positions of the bright spots as defined in the PAH feature map (Fig. 6) to facilitate comparison with that figure. We plot a contour at a feature to continuum value of 0.1 to make the lowest levels more visible against the black background. On top of the image we show logarithmically-spaced contours of the mid-IR [O iv] emission (Quillen et al. 2008) indicating the Narrow Line Region (see text) and two red lines indicative of the position angle of the radio/X-ray jet (Burns et al. 1983; Kraft et al. 2000).
Current usage metrics show cumulative count of Article Views (full-text article views including HTML views, PDF and ePub downloads, according to the available data) and Abstracts Views on Vision4Press platform.
Data correspond to usage on the plateform after 2015. The current usage metrics is available 48-96 hours after online publication and is updated daily on week days.
Initial download of the metrics may take a while.