Fig. 5
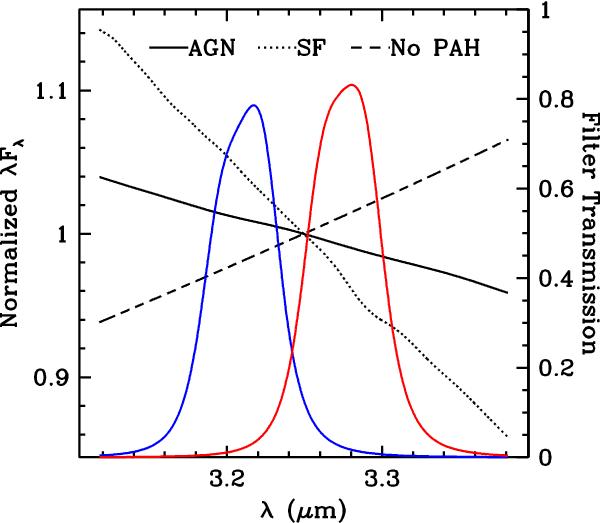
Illustration of the differences of continuum slope as a function of the dominant contributor to the continuum. The solid curve represents the AGN-dominated case (Netzer et al. 2007), while the dotted line shows our SB99 model results consistent with star formation (Dale et al. 2005). The dashed line indicates the continuum slope that would have to be present to result in no detected PAH emission at the position of the nucleus (see text). The continua have been normalized to unity at λ = 3.25 μm. For reference the two ISAAC filter curves are shown.
Current usage metrics show cumulative count of Article Views (full-text article views including HTML views, PDF and ePub downloads, according to the available data) and Abstracts Views on Vision4Press platform.
Data correspond to usage on the plateform after 2015. The current usage metrics is available 48-96 hours after online publication and is updated daily on week days.
Initial download of the metrics may take a while.