Fig. 2
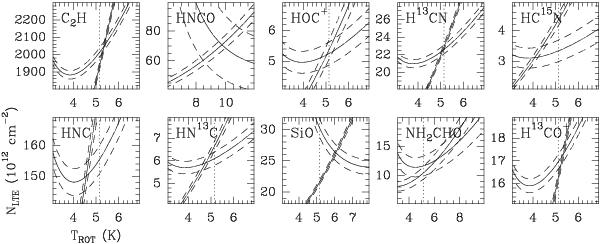
Evolution of the column density (NLTE) as a function of the rotation temperature (Trot) for the transitions of the molecular species observed in 2011 (Table A.1 and Eq. (4)). Each curve corresponds to a different transition and the dashed curves delimit the 1σ uncertainties. The curve intersections give the values of Ncol and Trot . The vertical dotted line indicates TCMB = 5.14 K.
Current usage metrics show cumulative count of Article Views (full-text article views including HTML views, PDF and ePub downloads, according to the available data) and Abstracts Views on Vision4Press platform.
Data correspond to usage on the plateform after 2015. The current usage metrics is available 48-96 hours after online publication and is updated daily on week days.
Initial download of the metrics may take a while.