Fig. 1
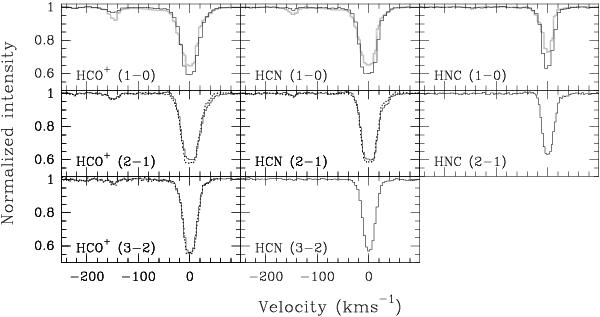
Spectra of the strong absorption of HCO+, HCN and HNC transitions observed in 2011 with ATCA (full black line). The dotted spectra correspond to the higher spectral resolution PdBI observations with the narrow-band correlator (see Table 1). The J = 1–0 spectra observed in our previous ATCA 7 mm survey (Muller et al. 2011) are superimposed in light grey. The intensity is normalized to the total continuum flux (NE plus SW images).
Current usage metrics show cumulative count of Article Views (full-text article views including HTML views, PDF and ePub downloads, according to the available data) and Abstracts Views on Vision4Press platform.
Data correspond to usage on the plateform after 2015. The current usage metrics is available 48-96 hours after online publication and is updated daily on week days.
Initial download of the metrics may take a while.