Free Access
Fig. 3
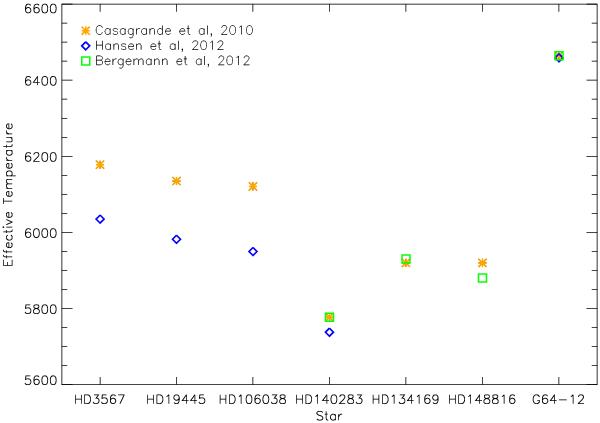
Comparison of effective temperatures determined with different methods for seven stars. The legend indicates the original paper (Casagrande et al. 2010; Hansen et al. 2012; Bergemann et al. 2012a,– yellow “*”, blue diamond, and green square, respectively) from which the temperatures have been taken.
Current usage metrics show cumulative count of Article Views (full-text article views including HTML views, PDF and ePub downloads, according to the available data) and Abstracts Views on Vision4Press platform.
Data correspond to usage on the plateform after 2015. The current usage metrics is available 48-96 hours after online publication and is updated daily on week days.
Initial download of the metrics may take a while.