Fig. 8
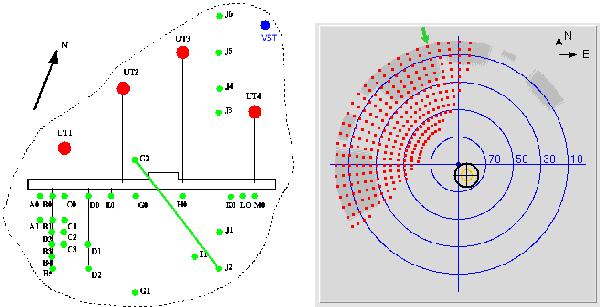
Left: layout of the Paranal observatory platform indicating the baseline used during the commissioning as shown by the APES software. Right: not accessible regions in the sky due to delay line limits (dotted regions) and UT shadowing (grey patches) for the baseline G2-J2 as shown by the VLTI observer panel. Labels mark the elevation angle.
Current usage metrics show cumulative count of Article Views (full-text article views including HTML views, PDF and ePub downloads, according to the available data) and Abstracts Views on Vision4Press platform.
Data correspond to usage on the plateform after 2015. The current usage metrics is available 48-96 hours after online publication and is updated daily on week days.
Initial download of the metrics may take a while.