Fig. C.3
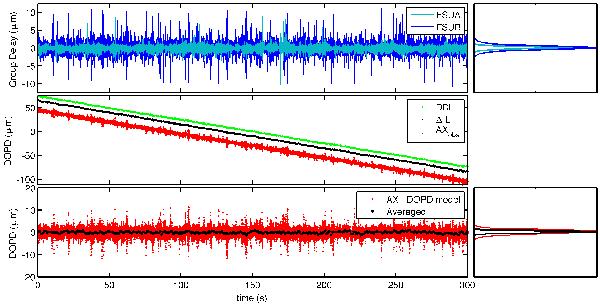
Summary graphic of a fringe tracking file. The top panel shows the raw group delays, the middle panel shows the change of differential delay measured with the DDL metrology, the PRIMA metrology, and the astrometric observable. The raw model-subtracted astrometric observable is shown in red in the lowermost panel and the 1-s averages are shown as solid black circles.
Current usage metrics show cumulative count of Article Views (full-text article views including HTML views, PDF and ePub downloads, according to the available data) and Abstracts Views on Vision4Press platform.
Data correspond to usage on the plateform after 2015. The current usage metrics is available 48-96 hours after online publication and is updated daily on week days.
Initial download of the metrics may take a while.