Fig. C.2
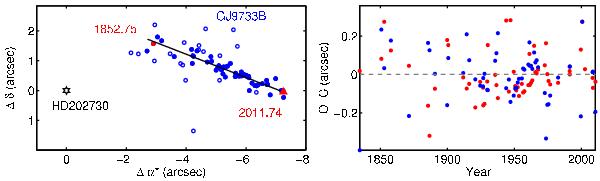
Linear fit to the relative motion of HD 202730. Left: the location of primary (black star) and secondary (blue circles) and the best linear fit (black line) are shown. Open circles identify measurements not considered for the fit. The expected separation in August 2011 is shown with the red triangle. Right: the fit residuals in RA (red) and Dec (blue).
Current usage metrics show cumulative count of Article Views (full-text article views including HTML views, PDF and ePub downloads, according to the available data) and Abstracts Views on Vision4Press platform.
Data correspond to usage on the plateform after 2015. The current usage metrics is available 48-96 hours after online publication and is updated daily on week days.
Initial download of the metrics may take a while.