Fig. 37
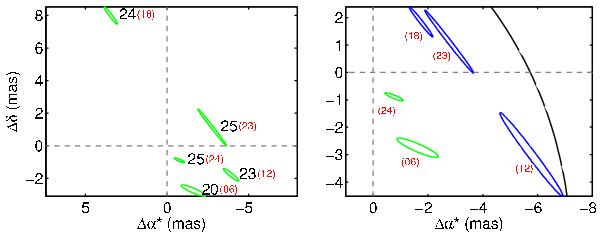
Left: PRIMA error ellipses from the analysis of the raw data on HD 10360 for the five epochs in November 2011. The offsets to a constant vector are shown. Numbers indicate the datum in November 2011 and numbers in brackets show the run number of the respective measurement. Right: the same, but after limiting the hour angle range of three epochs (blue). The black curve is the error ellipse section of NACO shown in Fig. 34.
Current usage metrics show cumulative count of Article Views (full-text article views including HTML views, PDF and ePub downloads, according to the available data) and Abstracts Views on Vision4Press platform.
Data correspond to usage on the plateform after 2015. The current usage metrics is available 48-96 hours after online publication and is updated daily on week days.
Initial download of the metrics may take a while.