Fig. 33
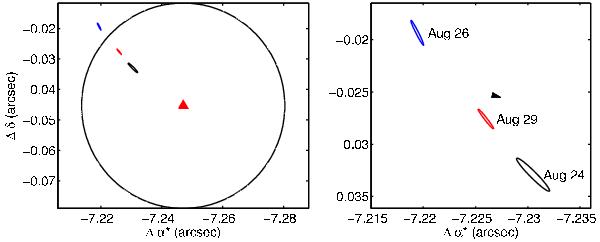
Left: the expected separation of HD 202730 at the end of August 2011 (red triangle) and its error ellipse (black curve). The 3-σ formal error ellipses of PRIMA measurements are visible at the upper left. Right: close-up view showing the large scatter relative to the expected motion of ~0.35 mas during the 5 day timespan shown by the black arrow.
Current usage metrics show cumulative count of Article Views (full-text article views including HTML views, PDF and ePub downloads, according to the available data) and Abstracts Views on Vision4Press platform.
Data correspond to usage on the plateform after 2015. The current usage metrics is available 48-96 hours after online publication and is updated daily on week days.
Initial download of the metrics may take a while.