Free Access
Fig. 31
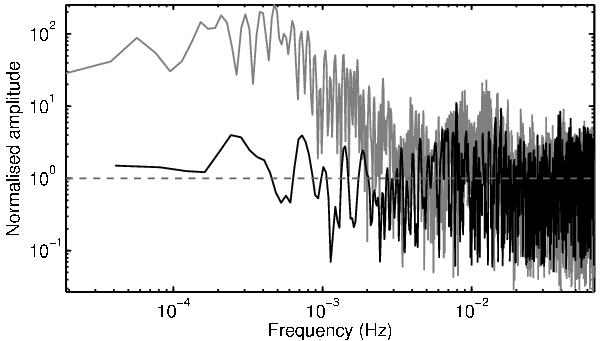
Lomb Scargle periodogram (Press et al. 1986) of the 1-s average residuals for the observations of HD 202730 (black curve, see Figs. 30 and C.7) and of HD 10360 (grey curve) shown in Fig. 28.
Current usage metrics show cumulative count of Article Views (full-text article views including HTML views, PDF and ePub downloads, according to the available data) and Abstracts Views on Vision4Press platform.
Data correspond to usage on the plateform after 2015. The current usage metrics is available 48-96 hours after online publication and is updated daily on week days.
Initial download of the metrics may take a while.