Fig. 30
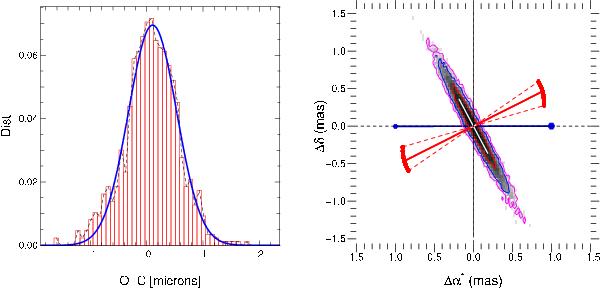
Left: residual’s histogram of the HD 202730 observation shown in Fig. C.7 and the best Gaussian fit to it. Right: the two-dimensional distribution of the relative secondary’s position in the sky for 10 000 Monte Carlo simulations is shown in grey-shading. Contour lines indicate 1, 2, 3-σ confidence intervals. The blue line indicates the position angle of the binary, the red circles show the equivalent u-v-coordinates of the observations, and the solid red line illustrates the average projected baseline orientation.
Current usage metrics show cumulative count of Article Views (full-text article views including HTML views, PDF and ePub downloads, according to the available data) and Abstracts Views on Vision4Press platform.
Data correspond to usage on the plateform after 2015. The current usage metrics is available 48-96 hours after online publication and is updated daily on week days.
Initial download of the metrics may take a while.