Fig. 28
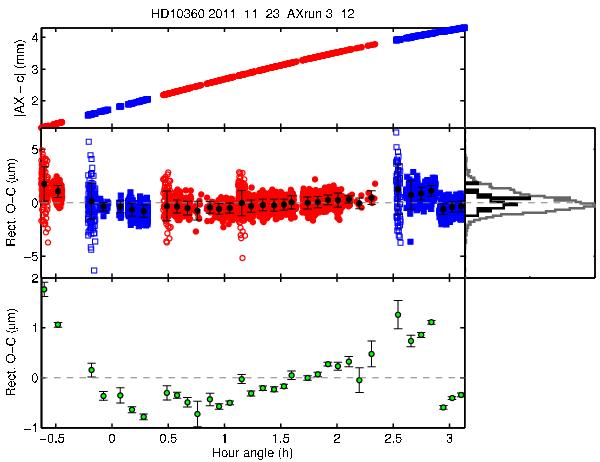
Top: absolute value of the measured differential delay | AXobs − c | for the demonstration run as a function of hour angle. Normal mode data are shown in red and swapped mode data in blue. Middle: rectified residuals of the astrometric fit. Open and filled symbols indicate scanning and tracking data, respectively. File-average bins are shown in black. Bottom: rectified and binned residuals with error bars that rely on Gaussian statistics (error of the mean).
Current usage metrics show cumulative count of Article Views (full-text article views including HTML views, PDF and ePub downloads, according to the available data) and Abstracts Views on Vision4Press platform.
Data correspond to usage on the plateform after 2015. The current usage metrics is available 48-96 hours after online publication and is updated daily on week days.
Initial download of the metrics may take a while.