Fig. 10
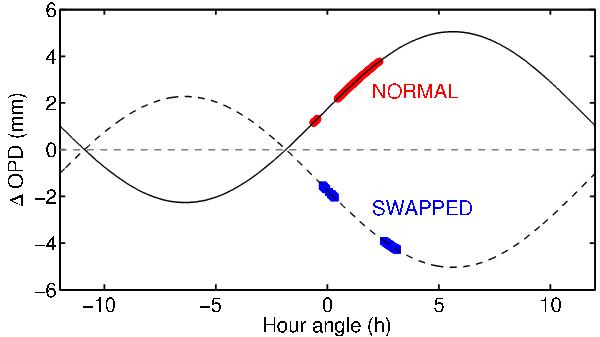
Expected differential delay for HD 10360 in normal (solid curve) and swapped mode (dashed curve) over 24 h. Red and blue symbols show the data of the demonstration run discussed below. The metrology zero point has been subtracted and is indicated by the horizontal dashed line. The delay amplitude varies between 0–5 mm.
Current usage metrics show cumulative count of Article Views (full-text article views including HTML views, PDF and ePub downloads, according to the available data) and Abstracts Views on Vision4Press platform.
Data correspond to usage on the plateform after 2015. The current usage metrics is available 48-96 hours after online publication and is updated daily on week days.
Initial download of the metrics may take a while.