Free Access
Fig. 9
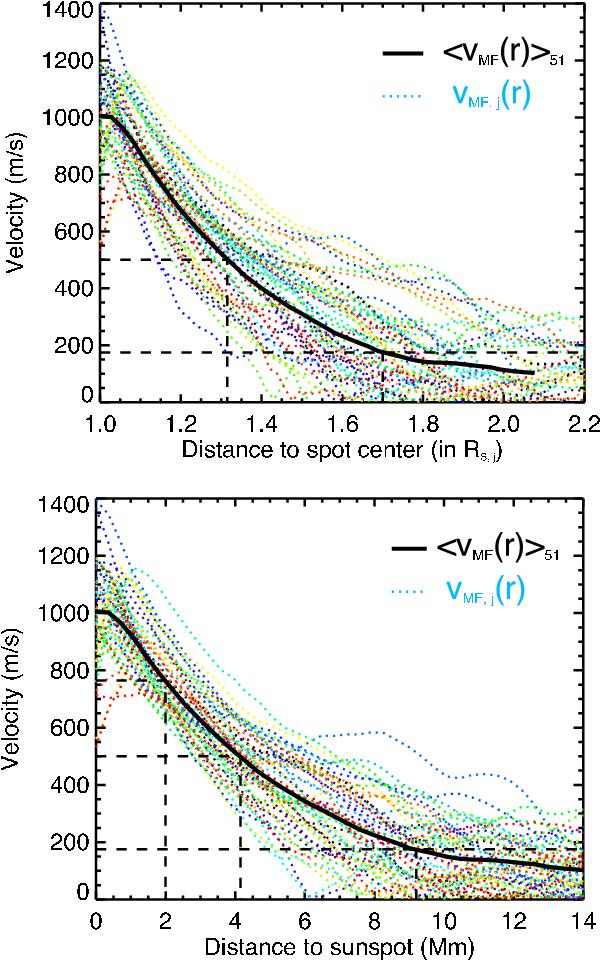
Horizontal MF velocities, vMF(r), in m/s of 51 observed 3 h velocity maps against the distance from the spot center in spot ratio (upper panel) and the distance to the sunspot in Mm (lower panel). The calculated average (black bold curve) is drawn.
Current usage metrics show cumulative count of Article Views (full-text article views including HTML views, PDF and ePub downloads, according to the available data) and Abstracts Views on Vision4Press platform.
Data correspond to usage on the plateform after 2015. The current usage metrics is available 48-96 hours after online publication and is updated daily on week days.
Initial download of the metrics may take a while.