Fig. 2
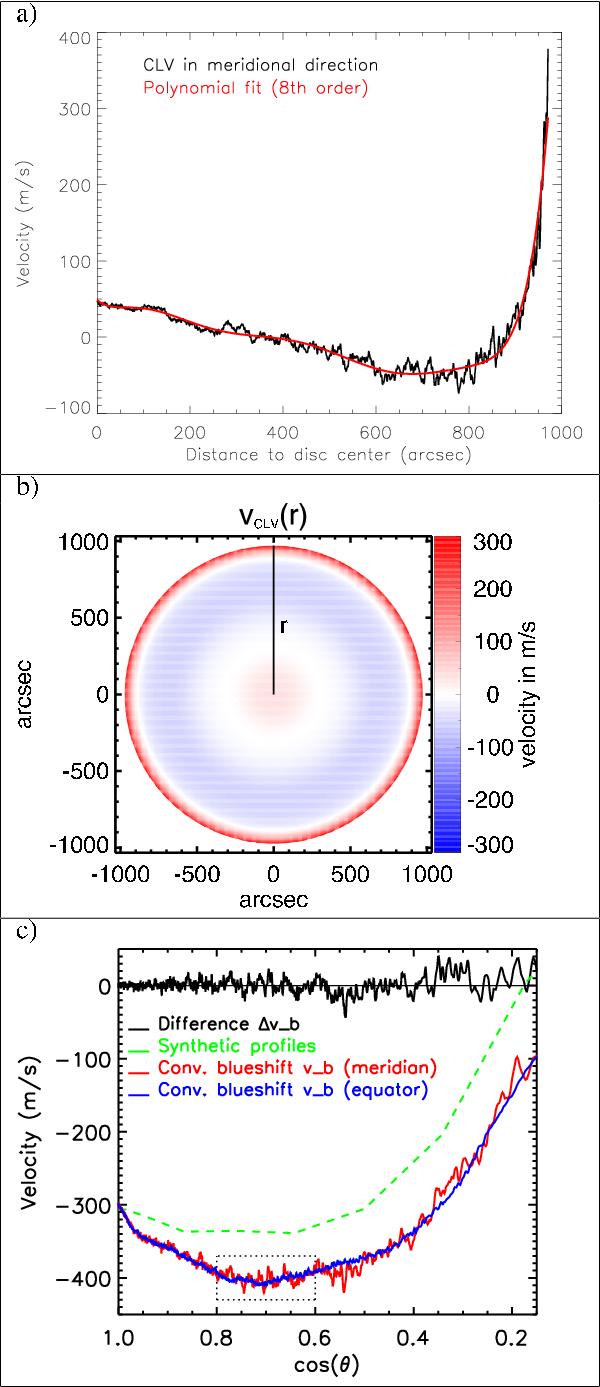
a) Average CLV,
⟨ v(0,y) ⟩ t,
along the meridional centerline with an 8th-order polynomial fit,
vclv(y) (red curve) in m/s against
the distance y to the disk center in arcsec. b)
Calibrated, radially symmetrical CLV model,
vclv(r), with axis given in arcsec.
c) Convective blueshift,
vb(r), in
 along the meridian (red solid curve) and equator (blue solid curve) and their
difference (black solid curve) displayed in m/s against cosθ with
heliocentric angle, θ. A synthesis of the spectral line from COBOLD
simulations (green dashed curve) is added. The dotted black box refers to the
preferred sunspot location.
along the meridian (red solid curve) and equator (blue solid curve) and their
difference (black solid curve) displayed in m/s against cosθ with
heliocentric angle, θ. A synthesis of the spectral line from COBOLD
simulations (green dashed curve) is added. The dotted black box refers to the
preferred sunspot location.
Current usage metrics show cumulative count of Article Views (full-text article views including HTML views, PDF and ePub downloads, according to the available data) and Abstracts Views on Vision4Press platform.
Data correspond to usage on the plateform after 2015. The current usage metrics is available 48-96 hours after online publication and is updated daily on week days.
Initial download of the metrics may take a while.