Fig. 10
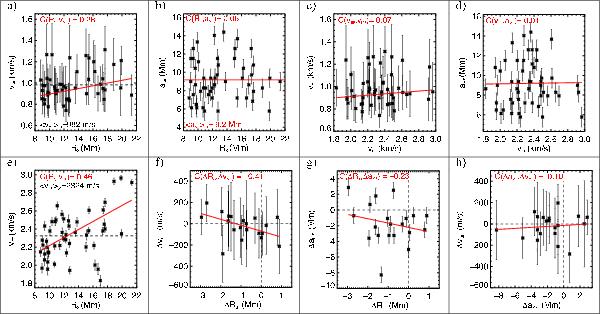
Correlations of sunspot and MF properties for all 51 sunspot maps
(a)–e)), v3h, and their evolution within
one week for 20 sunspots (f)–h)) indicated by linear regressions (red
lines) and the coefficients,  .
a) MF velocities, vMF, in m/s and
b) MF extensions, aMF, in Mm against the
sunspot radii, RS, in Mm with the average values,
⟨ vMF ⟩ 51 = 982 m/s and
⟨ aMF ⟩ 51 = 9.2 Mm. c) MF
velocities, vMF, in m/s and d) MF
extensions, aMF, in Mm against the maximum EF
velocities, vEF, in m/s. e) Maximum EF
velocities, vEF, in m/s against
RS in Mm with the average value,
⟨ vEF ⟩ 51 = 2324 m/s. f)
Weekly changes, ΔvMF, in m/s and g)
ΔaMF in Mm of the moat flow against
ΔRS in Mm. h) Weekly changes of MF
properties, ΔvMF, in m/s against
ΔaMF in Mm.
.
a) MF velocities, vMF, in m/s and
b) MF extensions, aMF, in Mm against the
sunspot radii, RS, in Mm with the average values,
⟨ vMF ⟩ 51 = 982 m/s and
⟨ aMF ⟩ 51 = 9.2 Mm. c) MF
velocities, vMF, in m/s and d) MF
extensions, aMF, in Mm against the maximum EF
velocities, vEF, in m/s. e) Maximum EF
velocities, vEF, in m/s against
RS in Mm with the average value,
⟨ vEF ⟩ 51 = 2324 m/s. f)
Weekly changes, ΔvMF, in m/s and g)
ΔaMF in Mm of the moat flow against
ΔRS in Mm. h) Weekly changes of MF
properties, ΔvMF, in m/s against
ΔaMF in Mm.
Current usage metrics show cumulative count of Article Views (full-text article views including HTML views, PDF and ePub downloads, according to the available data) and Abstracts Views on Vision4Press platform.
Data correspond to usage on the plateform after 2015. The current usage metrics is available 48-96 hours after online publication and is updated daily on week days.
Initial download of the metrics may take a while.