| Issue |
A&A
Volume 551, March 2013
|
|
|---|---|---|
| Article Number | A27 | |
| Number of page(s) | 4 | |
| Section | Planets and planetary systems | |
| DOI | https://doi.org/10.1051/0004-6361/201220541 | |
| Published online | 13 February 2013 | |
Micrometeoroids flux on the Moon
1 INAF-Astronomical Observatory of Padova, Vicolo dell’Osservatorio 5, 35131 Padova, Italy
e-mail: This email address is being protected from spambots. You need JavaScript enabled to view it.
; This email address is being protected from spambots. You need JavaScript enabled to view it.
2 Department of Physics and Astronomy, via Marzolo 8, 35131 Padova, Italy
e-mail: This email address is being protected from spambots. You need JavaScript enabled to view it.
3 Department of Mineralogical and Petrological Science, via Valperga Caluso 35, 10125 Torino, Italy
e-mail: This email address is being protected from spambots. You need JavaScript enabled to view it.
Received: 11 October 2012
Accepted: 24 December 2012
Abstract
Context. The Moon has a tenuous exosphere consisting of atoms that are ejected from the surface by energetic processes, including hypervelocity micrometeoritic impacts, photon-stimulated desorption by UV radiation, and ion sputtering.
Aims. We calculate the vapor and neutral Na production rates on the Moon caused by impacts of meteoroids in the radius range of 5−100 μm. We considered a previously published dynamical model to compute the flux of meteoroids at the heliocentric distance of the Moon.
Methods. The orbital evolution of dust particles of different sizes is computed with an N-body numerical code. It includes the effects of Poynting-Robertson drag, solar wind drag, and planetary perturbations. The vapor production rate and the number of neutral atoms released in the exosphere of the Moon are computed with a well-established formulation.
Results. The result shows that the neutral Na production rate computed following our model is higher than previous estimates. This difference can be due to the dynamical evolution model that we used to compute the flux and also to the mean velocity, which is 15.3 km s-1 instead of 12.75 km s-1 as reported in literature.
Conclusions. Until now, the micrometeoritic impacts have been considered a negligible source for the release of neutral sodium atoms into the exosphere compared to other mechanisms, but according to our calculations, the contribution may be 8% of the photo-stimulated desorption at the subsolar point, becoming similar in the dawn and dusk regions and dominant on the night side.
Key words: methods: statistical / meteorites, meteors, meteoroids / Moon
© ESO, 2013
1. Introduction
The Moon has an extended and tenuous exosphere that contains sodium and potassium. The presence of these two elements in the lunar atmosphere was first detected from optical ground-based observations made by Potter & Morgan (1988) and was confirmed by Tyler et al. (1988).
Different mechanisms and source processes have been proposed as possible sources of the sodium and potassium (Hunten & Sprague 1997; Killen & IP 1999), including sputtering by the solar wind, photon-stimulated desorption (Madey et al. 1998; Mendillo et al. 1999; Yakshinskiy & Madey 2004), thermal desorption (Yakshinskiy & Madey 2000), and micrometeoritic impacts (Cintala 1992; Mendillo & Baumgardner 1995; Cremonese & Verani 1997; Verani et al. 1998; Smith et al. 1999).
The loss processes of atoms from the surface are due to Jeans escape, photo-ionization with subsequent plasma pick-up by the solar wind, dispersal of neutral gases by solar radiation pressure, and recombination with oxygen on the surface. The continuous refill of the regolith layer on the Moon comes from meteorites. Repetitive impacts shake the surface by means of fragmentation and emersion of new material so there is a continuous turnover that supplies the surface with fresh material (Killen et al. 2007; Morgan et al. 1988).
The sodium distribution around the Moon, observed by mean wide-angle imaging (Flynn & Mendillo 1993) and the variation in the sodium emission with the altitude (Potter et al. 2000) seems caused by the photon-stimulated desorption (PSD), which was proposed as the dominant source mechanism of this element in the lunar exosphere (Sprague et al. 1992). Morgan et al. (1988) suggested impact vaporization due to micrometeoroids as a source for the steady-state exosphere of the Moon. This theory was validated during the Leonid meteor shower event in November 1998 (Smith et al. 1999). The ion sputtering is also believed to be a sodium source at the Moon (Potter & Norgan 1988), but there is no verified evidence about this contribution.
The present work reports the neutral Na production rate on the Moon caused by impacts of micrometeoroids that originate from the Main Belt asteroid. To estimate the total contribution of mass to the exosphere by the micrometeoroid impacts, we have to take into account the impactors flux on the Moon, the surface composition, and the interaction with the exosphere. We have considered the dynamical model of the micrometeoroids flux at the heliocentric distance of the Moon (Borin et al. 2009).
2. Dynamical evolution model
To estimate the meteoritic flux at the Moon we used the dynamical evolution model of dust particles of Marzari & Vanzani (1994), which numerically integrates a (N + 1) + M body problem (Sun + N planets + M body with negligible mass) with the high-precision integrator RA15 version of the RADAU integrator by Everarth (1985). Radiation, solar wind pressure, and Poynting-Robertson drag are included as perturbative forces together with the gravitational attractions of all planets in the solar system.
We computed the orbital evolution of the dust grains until all particles move well inside the orbit of Earth-Moon system. To estimate the flux of impacting grains we used a statistical approach since the number of computed impacts is negligible. Each time a dust grain falls within ten times the influence sphere of the Earth-Moon system, we recorded the minimum approach distance and the grain–planet relative velocity. At the end of the run we have a list of close encounters we can statistically analyze. We divided the encounters into bins of radial distance from the planet center and performed a leasts-squares fit to the data with a parabola function as P0R2. The leasts-squares fit, performed assuming a standard deviation for each data bin of  (where Ni is the number of close encounters in each bin), allows one to compute the parameter P0 (Marzari et al. 1996). Using for R the radius of Earth, we obtain the fractional number of impacts on the surface of the planet nM. To calibrate our results we used the flux curves obtained by Cremonese et al. (2012) who revised the dust particle flux impacting the Earth. They simulated the impact craters measured on the Long Duration Exposure Facility satellite with the shock physics code iSALE.
2.1. Flux on the Moon
To extrapolate the terrestrial flux to the Moon, we have taken into account the different gravitational focusing factor, considering that the micrometeoroid flux on the Moon can be computed from that on the Earth as (Vanzani et al. 1997)  (1)where FM is the flux at the Moon, FE is the flux at the Earth,
  km s-1 and
  km s-1 are the average impact velocities on the Moon and on the Earth derived from the dynamical model (Borin et al. 2009), neglecting atmospheric deceleration. The difference between the two values is mainly due to the diverse escape velocity. Using the velocity values previously reported, we obtain a flux on the Moon that is 0.6766 times that given on the Earth.
Another aspect to be considered for the flux arriving on the lunar surface is the possible shielding due to the Earth. To calculate the shielding factor we assumed as key parameter the distance between the two bodies. We computed the solid angle of Earth view from the Moon, on two orbit arcs centered on the perigee and the apogee, according to the following equation:  (2)where
  , with RE = Rmean + Ratmosphere = 6378.134 + 650 000 km and dEM is the Moon-Earth distance.
The ratio between Ω and the angle subtended from the area affected by the impacting particles, in a specific range of inclinations, is 10-3, which is negligible.
3. Rotation from an inertial barycentric frame to a body-fixed frame
To analyze asymmetries in the flux on the Moon we have to compute latitude and longitude of particles that impact the satellite. Computating the coordinates of dust particles that impact the Moon surface is performed in the body-fixed reference frame of the extended body. This necessitates introducing the rotation matrix from an inertial to a body-fixed reference frame.
Planetary coordinate systems are defined relative to their mean axis of rotation. The direction of the north pole is specified by the value of its right ascension α0 and declination δ0, whereas the location of the prime meridian is specified by the angle that is measured along the planet’s equator in an easterly direction with respect to the planet north pole from the node Q (located at right ascension 90° + α0) at the planet’s equator on the standard equator to the point B where the prime meridian crosses the planet’s equator. The right ascension of the point Q is 90◦ + α0 and the inclination of the planet’s equator to the standard equator is 90◦ − δ0. Because the prime meridian is assumed to rotate uniformly with the planet, W accordingly varies linearly with time. The rotation matrix C from inertial barycentric to body fixed frame is given by  (3)where the pole orientation angles α, δ and the direction of the prime meridian W are specified as linear function of time t measured from some epoch tp0 (Seidelmann et al. 2002), so
  (4)Usually,
  and
and  are measured in degrees per Julian Century so the term
  in the first two equation of (4) represents an interval in Julian Century of 36 525 day from the standard epoch. In contrast the term in Eq. (4) involving W represents a time interval measured in days from the standard epoch. The expressions for α and δ in the Moon system are taken from Seidelmann et al. (2002).
So we can obtain ![Mathematical equation: \begin{equation} \left\{ \begin{array}{l} X \\*[8pt] Y \\*[8pt] Z \end{array} \right\} = C(\alpha+90^{\circ},90^{\circ}-\delta,w)\left\{ \begin{array}{l} x \\*[8pt] y\\*[8pt] z \end{array} \right\}, \end{equation}](/articles/aa/full_html/2013/03/aa20541-12/aa20541-12-eq41.png) (5)where (X, Y, Z) are the particle coordinates in the Moon reference system considering the rotation of the satellite, whereas (x, y, z) are the particle coordinates at the minimum distance from the satellite in the inertial reference system.
(5)where (X, Y, Z) are the particle coordinates in the Moon reference system considering the rotation of the satellite, whereas (x, y, z) are the particle coordinates at the minimum distance from the satellite in the inertial reference system.
4. Vapor production
The volume of target material vaporized by a spherical particle of mass m and impacting velocity v, can be estimated using the relation given by Cintala (1992)  (6)where m and
  are the mass and density of the meteoroid that impacts the surface, c is a constant, d and e are given in km-1 s and km-2 s2 and depend on target temperature and projectile composition (Cintala 1992).
Assuming that the vapor composition is determined by the target composition, the production rate (atoms cm-2 s-1) of neutral atoms SNa, is calculated by the relation (Morgan & Killen 1997)  (7)where Mvap is the vapor production rate (g cm-2 s-1), pNa is the atomic weight of the atom, NA is the Avogadro number and fNa = 0.00356 is the mass fraction of the neutral atom in the surface as used in previous works (Bruno et al. 2006, 2007). It is possible to calculate Mvap by integrating the equation
  (8)where
  is the target density, φ(v,m) is the differential number of impacts as a function of the meteoroid velocity and radius, vmin = 0 km s-1, vmax = 80 km s-1, mmin = 1.309 × 10⁻⁹ g, mmax = 1.047 × 10⁻⁵ g.
Using the same formalism as Cintala (1992), the differential flux can be written as  (9)where f(v) is the velocity distribution of dust particles (s/km) and h(m) is the mass distribution function of the impacting particles (g-1 cm-2 s-1). The velocity distribution function is derived for the Moon from numerical simulations (Borin et al. 2009) and is given by the following equation
  (10)where a = 91.25 and b = 2.457 × 10⁴ are constants. The derived mass distribution function is given by
  (11)where hB(m) is a fit of the data obtained by means of simulations, hC(m) is the mass distribution function given by Cintala (1992) and k is an opportune constant, with the associate error, which tunes the Cintala mass distribution function to the simulations data (Borin et al. 2009).
5. Results
To compute the vapor production rate, the flux, and the number of neutral atoms released into the exosphere, we took into account four different sections of the lunar orbit: the apogee (330−30°), the perigee (150−210°), 60°−120°, and 240°−300°. Figure 1 shows the asteroidal micrometeoritic flux on the Moon as a function of the latitude for each sector. The plots were obtained assuming impacting dust particles in the radius range of 5−100 μm. There is clear evidence of the vapor production rate peak in the equatorial region. Table 1 shows the values of the vapor production rate, the number of Na atoms released into the exosphere, and the asteroidal micrometeoritic flux for each sector. Table 2 reports the value of the number of neutral sodium atoms calculated over the entire lunar orbit, which is higher than the values obtained by other authors (Table 3).
It is interesting to note that the higher Na production rate, according to our results, may be closer to the fit of the observations discussed by Sprague et al. (2012), where the authors showed a difference of one order of magnitude between the Na production rate caused by PSD and by impacts.
The difference in Na production rate caused by impacts is mostly due to the dynamical model that we used to obtain the flux and also to the mean velocities (15.3 km s-1 and 18.6 km s-1 for the Moon and the Earth) which are different from other previously assumed values (e.g. Cintala used 12.75 km s-1 for the Moon).
Our Na production rate is up to a factor 5.5 higher than the estimate reported by Bruno et al. (2007), who used the same Cintala equations, but without applying a specific dynamical model.
The most recent calibration of the terrestrial flux, that we have applied (Cremonese et al. 2012), contributed to reduce the difference with other authors to a factor 5, always assuming dust particles released by asteroids.
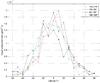 |
Fig. 1 Micrometeoritic flux on the Moon in the radius range of 5−100 μm in the four different sectors of the lunar orbit as a function of the latitude. |
Vapor production rate, number of Na atoms released, and micrometeoritic flux for each sector.
Mean values of vapor production rate, number of Na atoms released, and micrometeoritic flux over the entire lunar orbit.
Number of Na atoms obtained by different authors.
6. Conclusions
We reported the neutral Na production rate on the Moon caused by impacts of micrometeoroids that originate from Main Belt asteroids. To estimate the total contribution of mass to the exosphere by the micrometeoritic impacts, we took into account the flux on the Moon, the surface composition, and the interaction with the exosphere. We considered the dynamical evolution model of the micrometeoroids flux at the heliocentric distance of the Moon (Borin et al. 2009), calibrated according to Cremonese et al. (2012). We obtained the number of Na atoms as 1.648 × 10⁵ atoms/cm2 s, which is higher than the value of other authors, suggesting that the impact process due to micrometeoroids can play a very important role in the contribution of neutral atoms to the exosphere. Previous estimates assumed that the micrometeoritic impacts are a negligible source, about 1%, compared to the value of 2 × 10⁶ atoms/cm2 s produced by PSD (Morgan et al. 1989; Sarantos et al. 2010). Our new evaluation of the impact vaporization mechanism raises the contribution to the 8% of PSD at the subsolar point. Assuming that the PSD rate decreases as the cosine of the solar zenith angle, while our dynamical model shows no asymmetry in longitude for the micrometeoroids flux, the contribution of the impact vaporization becomes similar nearby the dawn and dusk regions and dominant in the night side.
Our result shows that impact vaporization is also very similar to the ion sputtering mechanism at the subsolar point, that is 2.65 × 10⁴ atoms/cm2 s (Sarantos et al. 2010), and is dominant for other longitudes.
References
- Borin, P., Cremonese, G., Marzari, F., et al. 2009, A&A, 503, 259 [NASA ADS] [CrossRef] [EDP Sciences] [Google Scholar]
- Bruno, M., Cremonese, G., Marchi, S., et al. 2006, MNRAS, 367, 1067 [NASA ADS] [CrossRef] [Google Scholar]
- Bruno, M., Cremonese, G., & Marchi, S. 2007, Planet. Space Sci., 55, 1494 [NASA ADS] [CrossRef] [Google Scholar]
- Burns, J. A., Lamy, P. L., & Soter, S. 1979, Icarus, 40, 1 [NASA ADS] [CrossRef] [Google Scholar]
- Cintala, M. J. 1992, J. Geophys. Res., 97, 947 [NASA ADS] [CrossRef] [Google Scholar]
- Cremonese, G., & Verani, S. 1997, Adv. Space Res., 19, 1561 [NASA ADS] [CrossRef] [Google Scholar]
- Cremonese, G., Bruno, M., Mangano, V., et al. 2005, Icarus, 177, 122 [NASA ADS] [CrossRef] [Google Scholar]
- Cremonese, G., Borin, P., Martellato, E., et al. 2012, ApJ, 749, L40 [NASA ADS] [CrossRef] [Google Scholar]
- Everhart, E. 1985, Astrophys. Space Sci. Lib., 115, 185 [NASA ADS] [CrossRef] [Google Scholar]
- Flynn, B., & Mendillo, M. 1993, Science, 261, 184 [NASA ADS] [CrossRef] [Google Scholar]
- Grün, E., Zook, H. A., Fechtig, H., et al. 1985, Icarus, 62, 244 [NASA ADS] [CrossRef] [Google Scholar]
- Hunten, D. M., & Sprague, A. L. 1997, Adv. Space Res., 19, 1551 [NASA ADS] [CrossRef] [Google Scholar]
- Killen, R. M., & Ip, W-H. 1999, Rev. Geophys., 37, 361 [NASA ADS] [CrossRef] [Google Scholar]
- Killen, R. M., Cremonese, G., Lammer, H., et al. 2007, Space Sci. Rev., 132, 433 [NASA ADS] [CrossRef] [Google Scholar]
- Madey, T. E., Yakshinskiy, B. V., Ageev, V. N., et al. 1998, J. Geophys. Res., 103, 5873 [Google Scholar]
- Marzari, F., & Vanzani, V. 1994, A&A, 283, 275 [NASA ADS] [Google Scholar]
- Marzari, F., Scholl, H., Farinella, P., et al. 1996, Icarus, 119, 192 [NASA ADS] [CrossRef] [Google Scholar]
- Mendillo, M., & Baumgardner, J. 1995, Nature, 377, 404 [NASA ADS] [CrossRef] [Google Scholar]
- Mendillo, M., Baumgardner, J., Wilson, J., et al. 1999, Icarus, 137, 13 [NASA ADS] [CrossRef] [Google Scholar]
- Morgan, T. H., & Killen, R. M. 1997, Space Sci., 45, 81 [NASA ADS] [CrossRef] [Google Scholar]
- Morgan, T. H., Zook, H. A., & Potter, A. E, 1988, Icarus, 75, 156 [NASA ADS] [CrossRef] [Google Scholar]
- Morgan, T. H., Zook, H. A., & Potter, A. E. 1989, Production of sodium vapor from exposed regolith in the inner Solar System, Proc. 19th Lunar Sci. Conf., 297 [Google Scholar]
- Potter, E. E., & Morgan, T. H. 1988, Science, 241, 675 [NASA ADS] [CrossRef] [Google Scholar]
- Potter, A. E., Killen, R. M., & Morgan, T. H. 2000, J. Geophys. Res., 105, 15073 [NASA ADS] [CrossRef] [Google Scholar]
- Sarantos, M., Killen, R. M., Surjalal Sharma, A., et al. 2010, Icarus, 205, 364 [NASA ADS] [CrossRef] [Google Scholar]
- Seidelmann, P. K., Abalakin, V. K., Bursa, M., et al. 2002, Celest. Mech. Dyn. Astron., 82, 83 [Google Scholar]
- Smith, S. M., Wilson, J. K., Baumgardner, J., et al. 1999, Geophys. Res. Lett., 26, 1649 [NASA ADS] [CrossRef] [Google Scholar]
- Sprague, A. L., Kozlowski, R. W. H., Hunten, D. M, et al. 1992, Icarus, 96, 27 [NASA ADS] [CrossRef] [Google Scholar]
- Sprague, A. L., Sarantos, M., Hunten, D. M, et al. 2012, Can. J. Phys., 90, 1 [CrossRef] [Google Scholar]
- Tyler, A. L., Hunten, D. M., Kozlowski, R. W. H., et al. 1988, Geophys. Res. Lett., 15, 1141 [NASA ADS] [CrossRef] [Google Scholar]
- Vanzani, V., Marzari, F., Dotto, E., et al. 1997, Lunar and Planetary Science XXVIII [Google Scholar]
- Verani, S., Barbieri, C., Benn, C., et al. 1998, Planet Space Sci., 46, 1003 [Google Scholar]
- Yakshinskiy, B. V., & Madey, T. E. 2000, Surf. Sci., 451, 160 [NASA ADS] [CrossRef] [Google Scholar]
- Yakshinskiy, B. V., & Madey, T. E. 2004, Icarus, 168, 53 [NASA ADS] [CrossRef] [Google Scholar]
All Tables
Vapor production rate, number of Na atoms released, and micrometeoritic flux for each sector.
Mean values of vapor production rate, number of Na atoms released, and micrometeoritic flux over the entire lunar orbit.
All Figures
|
Fig. 1 Micrometeoritic flux on the Moon in the radius range of 5−100 μm in the four different sectors of the lunar orbit as a function of the latitude. |
| In the text | |
Current usage metrics show cumulative count of Article Views (full-text article views including HTML views, PDF and ePub downloads, according to the available data) and Abstracts Views on Vision4Press platform.
Data correspond to usage on the plateform after 2015. The current usage metrics is available 48-96 hours after online publication and is updated daily on week days.
Initial download of the metrics may take a while.