Fig. 20
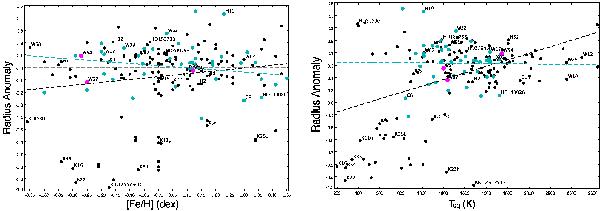
Radius anomaly, ℛ versus [Fe/H] (dex) (left panel), and as a function of Teq (K) (right panel). The radius anomaly is calculated using the Enoch et al. (2012) empirical relation for planetary radii. Symbols are like in Fig. 19. Our three new discoveries are indicated by fuchsia filled circles.
Current usage metrics show cumulative count of Article Views (full-text article views including HTML views, PDF and ePub downloads, according to the available data) and Abstracts Views on Vision4Press platform.
Data correspond to usage on the plateform after 2015. The current usage metrics is available 48-96 hours after online publication and is updated daily on week days.
Initial download of the metrics may take a while.