Fig. 2
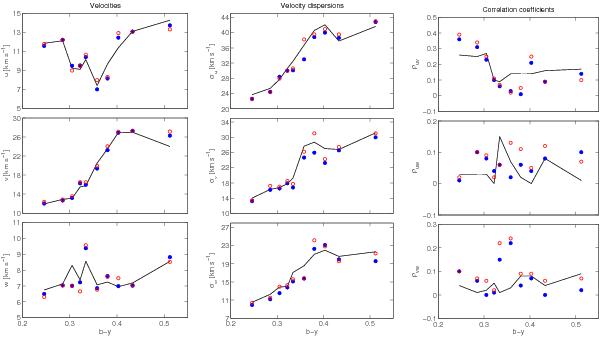
Left: mean velocities  versus color index b − y for stars in the Geneva-Copenhagen (GC) survey. Middle: velocity dispersions σu,σv,σw versus color index b − y for stars in the GC survey. Right: correlation coefficients ρij = Dij(DiDjj) − 1/2 (where i,j = u,v,w) from the estimated dispersion matrix versus color index b − y for stars in the GC survey. Values calculated directly from the GC data are shown as a solid line. The symbols represent the two different methods used: PM (°), ML (•).
Current usage metrics show cumulative count of Article Views (full-text article views including HTML views, PDF and ePub downloads, according to the available data) and Abstracts Views on Vision4Press platform.
Data correspond to usage on the plateform after 2015. The current usage metrics is available 48-96 hours after online publication and is updated daily on week days.
Initial download of the metrics may take a while.