Fig. 1
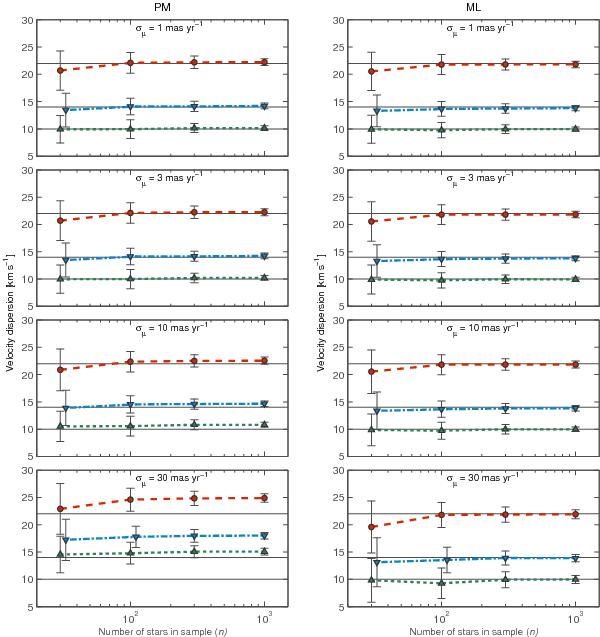
Plots illustrating velocity dispersion versus the number of stars, for different values of σμ, as calculated for the synthetic samples described in Sect. 4.1. Diagrams in the left column are for the projection method (PM), the right column is for the maximum likelihood method (ML). The symbols represent the different galactic components of the dispersion: σu (•), σv (▾), σw (▴). The true values are indicated by the horizontal lines.
Current usage metrics show cumulative count of Article Views (full-text article views including HTML views, PDF and ePub downloads, according to the available data) and Abstracts Views on Vision4Press platform.
Data correspond to usage on the plateform after 2015. The current usage metrics is available 48-96 hours after online publication and is updated daily on week days.
Initial download of the metrics may take a while.