Fig. 5
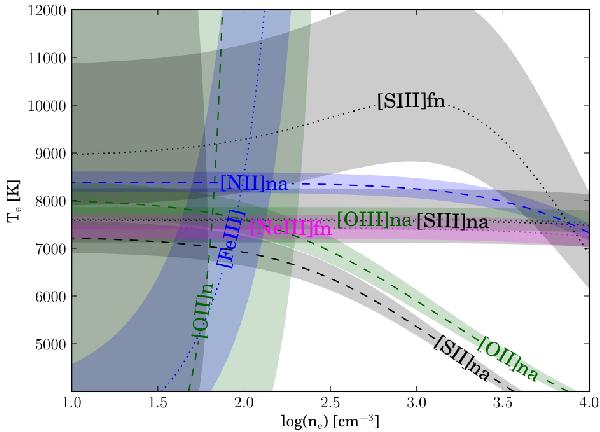
Plasma diagnostics using PyNeb. The dashed or dotted values indicate the density-temperature loci corresponding to the observed reddening-corrected line ratios (also aperture-corrected when combining Spitzer and optical data, as explained in Sect. 4). The coloured bands delineate the one sigma error zones in the corresponding ratios. Diagnostics involving oxygen ions are in green: [O ii]na 3727+/7325+; [O ii]n: 3729/3726; [O iii]na: 5007/4363. Diagnostics involving sulfur ions are in black: [S ii]n: 6716/6731; [S ii]na: 6720+/4072+; [S iii]fn: 18.7 μm/9069; [S iii]na: 9069/6312; the [N ii]na 6584/5755 diagnostic is in blue; the [Ne iii]fn 15.6 μm/3869 diagnostic is in pink; finally the [Fe iii] 5272/4987 diagnostic is in blue. (The characters n, a, f in the denomination of the line ratios stand for “nebular”, “auroral” and “fine-structure”, respectively).
Current usage metrics show cumulative count of Article Views (full-text article views including HTML views, PDF and ePub downloads, according to the available data) and Abstracts Views on Vision4Press platform.
Data correspond to usage on the plateform after 2015. The current usage metrics is available 48-96 hours after online publication and is updated daily on week days.
Initial download of the metrics may take a while.