Fig. 1
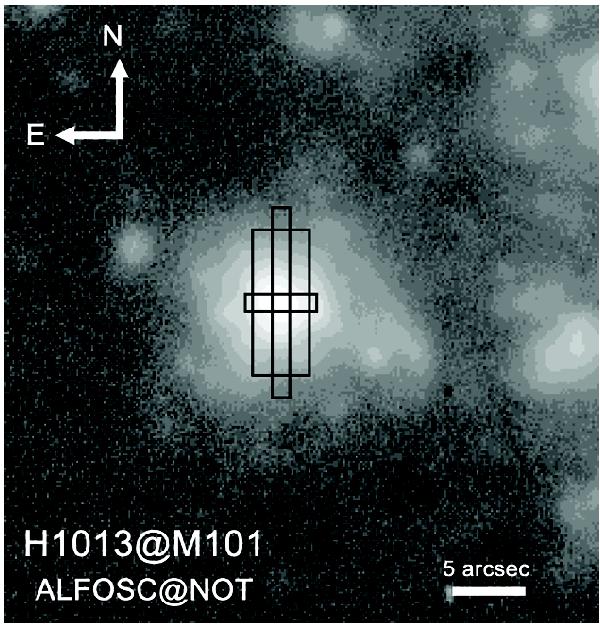
Portion of the Hα continuum-subtracted image of M 101 presented by Cedrés & Cepa (2002) showing the H ii region H 1013. The apertures corresponding to the optical and infrared spectra used in this study are also indicated for reference: the long narrow one corresponds to the LRIS data, the short narrow one to the HIRES data, and the wide one to the mid-infrared observations (note that the slit orientation is arbitrary).
Current usage metrics show cumulative count of Article Views (full-text article views including HTML views, PDF and ePub downloads, according to the available data) and Abstracts Views on Vision4Press platform.
Data correspond to usage on the plateform after 2015. The current usage metrics is available 48-96 hours after online publication and is updated daily on week days.
Initial download of the metrics may take a while.