Fig. 1
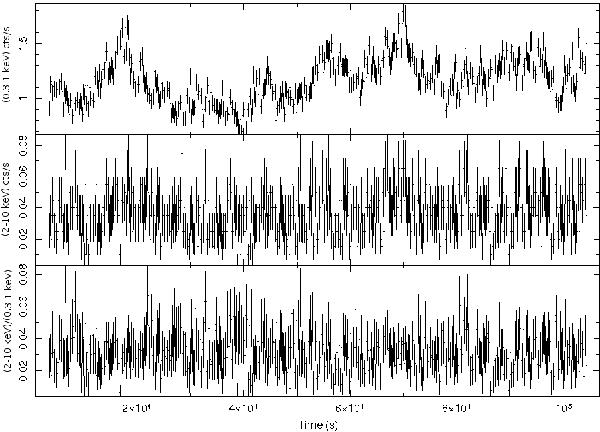
Upper panel: background-substracted LETGS ± 1 order light curve of Ark 564 binned at 200 s. The light curve shows 0.3−1 keV flux variation. The shortest (detectable) timescale is ~1.2 ks. The min/max amplitude change ΔC (Cmin at ~38 ks to Cmax at ~70 ks from the start of the observation), is ~60%. See text for more details. Middle panel: the light curve shows the hard band 2−10 keV flux variation. Bottom panel: the hardness ratio hard/soft band shows no important variation.
Current usage metrics show cumulative count of Article Views (full-text article views including HTML views, PDF and ePub downloads, according to the available data) and Abstracts Views on Vision4Press platform.
Data correspond to usage on the plateform after 2015. The current usage metrics is available 48-96 hours after online publication and is updated daily on week days.
Initial download of the metrics may take a while.