Fig. 6
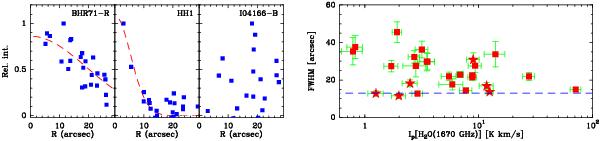
Left: sample of intensity radial profiles illustrating the different cases encountered in the analysis of the 1670 GHz line PACS data: outflow with extended emission (BHR71-R), outflow with compact emission (HH1), and outflow with emission that is too weak to allow a meaningful fit (I04166-B). Blue dots are PACS data and red dashed lines are Gaussian fits. Right: comparison between the size (uncorrected for the telescope beam) and intensity of the H2O-emitting region as determined from the Gaussian fits illustrated in the left panel. The star symbols indicate data from maps centered at a YSO position and the horizontal dotted line indicates the telescope FWHM at 1670 GHz (13′′).
Current usage metrics show cumulative count of Article Views (full-text article views including HTML views, PDF and ePub downloads, according to the available data) and Abstracts Views on Vision4Press platform.
Data correspond to usage on the plateform after 2015. The current usage metrics is available 48-96 hours after online publication and is updated daily on week days.
Initial download of the metrics may take a while.