Fig. 3
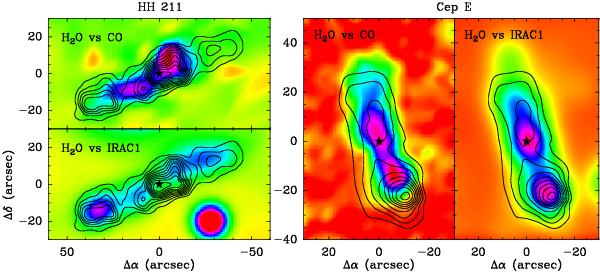
Comparison between H2O(1670 GHz) integrated intensity (contours) and either CO(2−1) or H2-dominated IRAC1 images (color-coded background) for the HH 211 and Cepheus E outflows. The IRAC1 image has been convolved to a resolution of 13′′ to match the resolution of the H2O(1670 GHz) and CO(2−1) data. For H2O(1670 GHz), first contour and contour interval are 1 K km s-1 for HH211 and 8 K km s-1 for Cep E. The CO map of HH211 uses data presented in Tafalla et al. (2006), and represents CO(2−1) intensities integrated in the velocity range | V − V0 | ≤ 5 − 20 km s-1 (ambient cloud velocity V0 = 8.6 km s-1). The CO map of Cep E represents CO(2−1) intensities integrated in the range | V − V0 | ≤ 10 − 50 km s-1 (ambient cloud velocity V0 = −13 km s-1), and has been shifted by 5′′ to the west to correct for a possible pointing problem suggested by an overlap with the better-registered interferometer map of Moro-Martín et al. (2001). Note the better agreement of the H2O with the H2-dominated IRAC1 emission than with the CO(2−1) emission. In all plots, the star symbol indicates the position of the YSO, which is the origin of the offset values and whose absolute coordinates are given in Table 1. The bright circular feature near (− 30′′, − 20′′) in the HH 211 IRAC1 image corresponds to an unrelated star.
Current usage metrics show cumulative count of Article Views (full-text article views including HTML views, PDF and ePub downloads, according to the available data) and Abstracts Views on Vision4Press platform.
Data correspond to usage on the plateform after 2015. The current usage metrics is available 48-96 hours after online publication and is updated daily on week days.
Initial download of the metrics may take a while.