Fig. 13
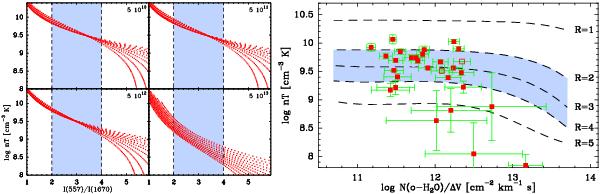
Left: gas thermal pressure nT vs. I(557) / I(1670) as determined by a series of LVG models. Each panel summarizes the result from more than 1000 LVG models of different density and temperature (see text), together with a constant value of N(H2O) / ΔV indicated in the upper right corner (units are cm-2 km-1 s). The blue-shaded region marks the interval of ratios between 2 and 4 that contains 60% of the outflow sample. Right: thermal pressure nT vs. N(H2O) / ΔV for the outflows in our sample. Each point represents an outflow (open squares correspond to L1157-B1 and L1148-R4), and the mean values and error bars have been determined from the LVG results shown in Fig. 12. The dashed lines labeled with R (= I(557) / I(1670)) have been derived from the models in the left panels. Again, the region between R values of 2 and 4 is shaded in blue.
Current usage metrics show cumulative count of Article Views (full-text article views including HTML views, PDF and ePub downloads, according to the available data) and Abstracts Views on Vision4Press platform.
Data correspond to usage on the plateform after 2015. The current usage metrics is available 48-96 hours after online publication and is updated daily on week days.
Initial download of the metrics may take a while.