Free Access
Fig. 2
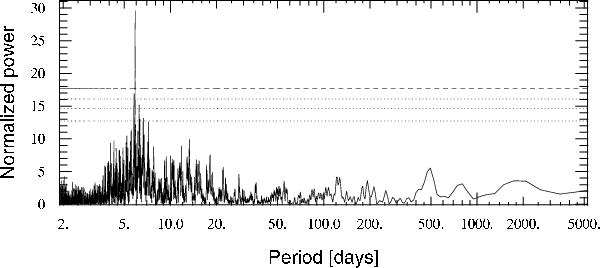
Periodogram of the RV data for HD 103774. A significant peak is visible at ≈5.9 days. The topmost dashed line is the 10-4 false-alarm probability, the lower dotted lines correspond to 10-3, 10-2, and 10-1 false-alarm probabilities.
Current usage metrics show cumulative count of Article Views (full-text article views including HTML views, PDF and ePub downloads, according to the available data) and Abstracts Views on Vision4Press platform.
Data correspond to usage on the plateform after 2015. The current usage metrics is available 48-96 hours after online publication and is updated daily on week days.
Initial download of the metrics may take a while.