Fig. 11
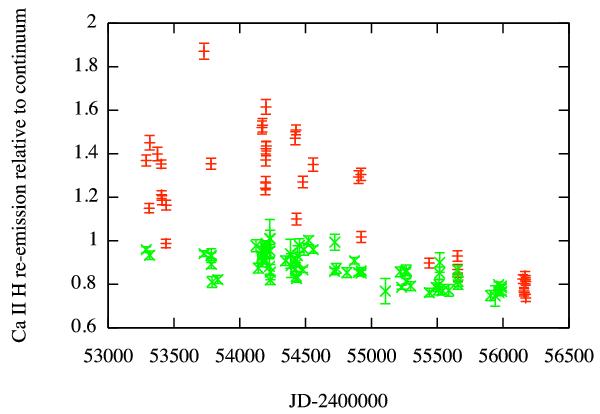
Evolution in time of the integrated flux in the Ca II H line of BD-061339. The star appears much less active during the last observation campaigns. The red points (darker) represent the amplitude of the Ca II H re-emission normalized at 6540 Å, while the green points (lighter) represent the SMW index. The latter one is heavily affected by the low S/N in the blue side of the spectrum.
Current usage metrics show cumulative count of Article Views (full-text article views including HTML views, PDF and ePub downloads, according to the available data) and Abstracts Views on Vision4Press platform.
Data correspond to usage on the plateform after 2015. The current usage metrics is available 48-96 hours after online publication and is updated daily on week days.
Initial download of the metrics may take a while.