Fig. 8
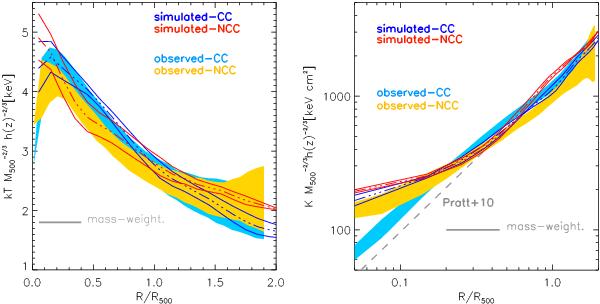
Comparison of average temperature (left) and entropy (right) profiles for the observed CC (cyan) and the NCC (yellow) populations derived from the median of the 18 objects, and the CC-like (blue) and NCC-like (red) populations simulated with ENZO. The dot-dashed lines show the median profiles from our simulated ENZO sample, while the solid lines indicate the confidence intervals on the median. In the right panel, we additionally show the self-similar expectation from Pratt et al. (2010) (dashed gray line).
Current usage metrics show cumulative count of Article Views (full-text article views including HTML views, PDF and ePub downloads, according to the available data) and Abstracts Views on Vision4Press platform.
Data correspond to usage on the plateform after 2015. The current usage metrics is available 48-96 hours after online publication and is updated daily on week days.
Initial download of the metrics may take a while.