Free Access
Fig. 7
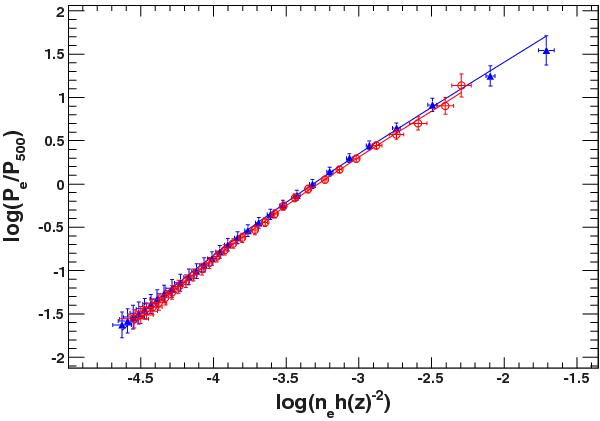
log P − log n diagram for the CC (blue triangles) and NCC (red circles) cluster populations. The solid lines show the best fit to the data using a rolling index.
Current usage metrics show cumulative count of Article Views (full-text article views including HTML views, PDF and ePub downloads, according to the available data) and Abstracts Views on Vision4Press platform.
Data correspond to usage on the plateform after 2015. The current usage metrics is available 48-96 hours after online publication and is updated daily on week days.
Initial download of the metrics may take a while.