Fig. 5
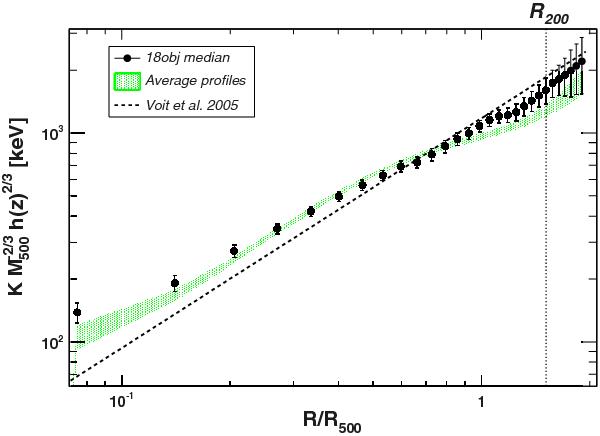
Average self-similar scaled entropy profiles obtained from the median of the 18 individual systems (black points) and the average pressure and density profiles (green shaded area). For comparison, the dashed line shows the relation expected from gravitational collapse only (Voit et al. 2005), using the proper normalization (Eq. (10)).
Current usage metrics show cumulative count of Article Views (full-text article views including HTML views, PDF and ePub downloads, according to the available data) and Abstracts Views on Vision4Press platform.
Data correspond to usage on the plateform after 2015. The current usage metrics is available 48-96 hours after online publication and is updated daily on week days.
Initial download of the metrics may take a while.