Fig. 4
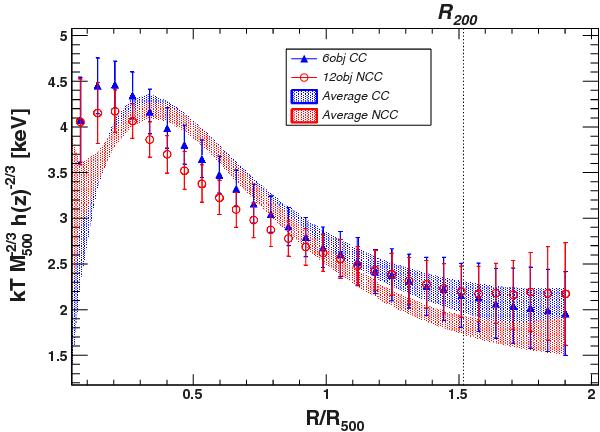
Average self-similar scaled temperature profiles for the CC (blue) and NCC (red) populations separately. The shaded areas show the results obtained by combining the average CC/NCC pressure profiles from P13 with the corresponding profile from E12, while the data points show the median of the individual systems in common between the two samples.
Current usage metrics show cumulative count of Article Views (full-text article views including HTML views, PDF and ePub downloads, according to the available data) and Abstracts Views on Vision4Press platform.
Data correspond to usage on the plateform after 2015. The current usage metrics is available 48-96 hours after online publication and is updated daily on week days.
Initial download of the metrics may take a while.