Free Access
Fig. C.2
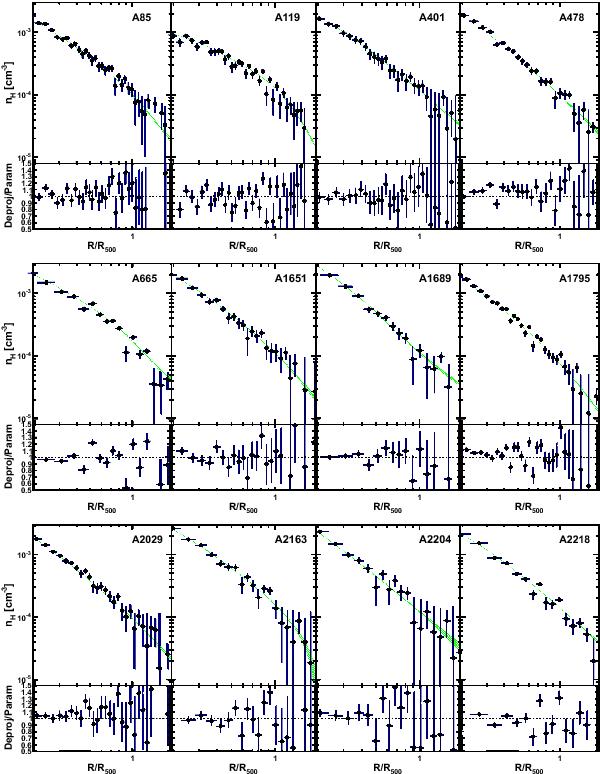
ROSAT density profiles of the 18 systems obtained through geometrical deprojection (black points) and parametric forward fitting (green-shaded areas), in the radial range of interest for this paper ([0.2 − 1.9] R500). The bottom panels show the ratio between the two methods.
Current usage metrics show cumulative count of Article Views (full-text article views including HTML views, PDF and ePub downloads, according to the available data) and Abstracts Views on Vision4Press platform.
Data correspond to usage on the plateform after 2015. The current usage metrics is available 48-96 hours after online publication and is updated daily on week days.
Initial download of the metrics may take a while.