Fig. 1
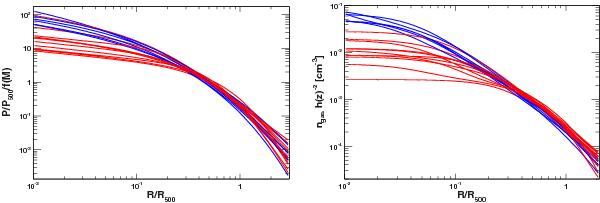
Thermal pressure (left, using the best-fit parameters from P13) and gas number density profiles (right, from E12) for the 18 objects in common between the two samples. The profiles are drawn using the functional forms defined in Eqs. (5) and (8), respectively. In both cases, blue lines indicate CC systems, while NCC profiles are shown in red.
Current usage metrics show cumulative count of Article Views (full-text article views including HTML views, PDF and ePub downloads, according to the available data) and Abstracts Views on Vision4Press platform.
Data correspond to usage on the plateform after 2015. The current usage metrics is available 48-96 hours after online publication and is updated daily on week days.
Initial download of the metrics may take a while.