Fig. 5
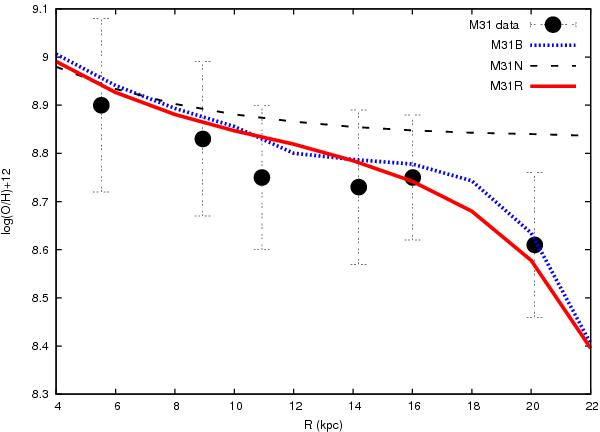
Radial oxygen abundance gradient. The blue dotted line refers to the model M 31B of Marcon-Uchida et al. (2010), the black dashed line to the M 31N model with a constant SF efficiency, fixed at the value of 2 Gyr-1, and without threshold, the red solid line refers to the best fit model M 31R with a radial inflow of gas. The filled circles and relative error bars are the observed values from HII regions.
Current usage metrics show cumulative count of Article Views (full-text article views including HTML views, PDF and ePub downloads, according to the available data) and Abstracts Views on Vision4Press platform.
Data correspond to usage on the plateform after 2015. The current usage metrics is available 48-96 hours after online publication and is updated daily on week days.
Initial download of the metrics may take a while.