Fig. 4
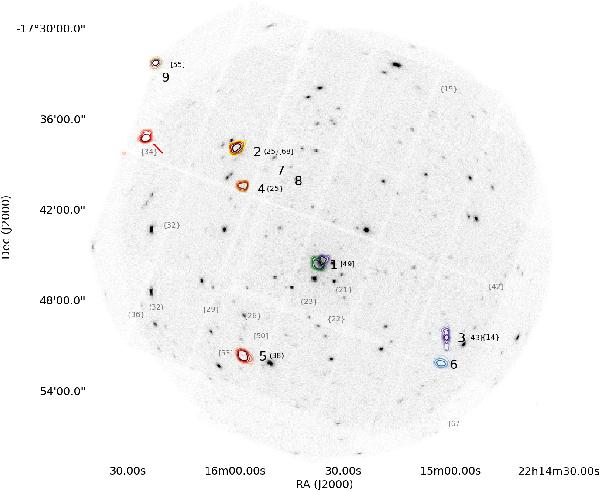
Over-density contours of galaxies within the field of view of the XMM-Newton pointing. The background image is the stacked image of all XMM-Newton observations of LBQS2212 (0.5–2.0 keV). The extended X-ray sources from Fig. 1 are indicated with their identifiers on the side (1 arcmin offset in RA). In smaller fonts the identifiers from other works are indicated either in black, if presented in this work as well, or in grey if not found by our method. Between round brackets the identifier from Bielby et al. (2010) is indicated and square brackets refer to the catalogue from Olsen et al. (2007). Curly brackets present the clusters from Adami et al. (2010). The red arrow points at an optical over-density, which has no clear counterpart in X-rays. The contours represent 5 Poissonian likelihood levels with 10 < L < Lmax, colour-coded, or rather colour-mapped, by redshift interval: purple z = 0.3 Lmax = 15, blue z = 0.35 Lmax = 20, green z = 0.45 Lmax = 20, dark pink z = 0.78 Lmax = 30, orange z = 0.98 Lmax = 15, red z = 1.18 Lmax = 20, heat z = 1.38 Lmax = 20, where z refers to  , i.e. the middle of the bin.
Current usage metrics show cumulative count of Article Views (full-text article views including HTML views, PDF and ePub downloads, according to the available data) and Abstracts Views on Vision4Press platform.
Data correspond to usage on the plateform after 2015. The current usage metrics is available 48-96 hours after online publication and is updated daily on week days.
Initial download of the metrics may take a while.