Fig. 27
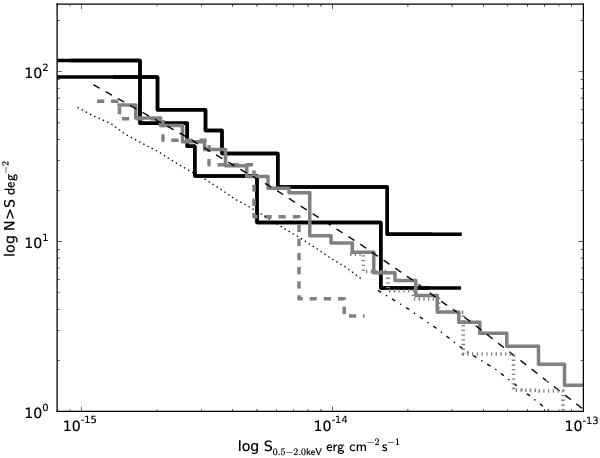
Cosmological log N − log S for clusters of galaxies. The black discrete curve shows the confidence interval resulting from measured source detection flux errors and an additional  on the number count from this work. A comparison to comparable surveys is made. The curves show the model from Rosati et al. (2002) for no evolution (dashed). The dot-dashed and dotted lines show the measured ROSAT brightest cluster sample (BCS, Ebeling et al. 1998) clusters and their extrapolation, respectively. The discrete lines display the findings from COSMOS (solid) (Finoguenov et al. 2007), SXDF (dashed) (Finoguenov et al. 2010), and XMM-BCS (dotted) (Šuhada et al. 2012).
Current usage metrics show cumulative count of Article Views (full-text article views including HTML views, PDF and ePub downloads, according to the available data) and Abstracts Views on Vision4Press platform.
Data correspond to usage on the plateform after 2015. The current usage metrics is available 48-96 hours after online publication and is updated daily on week days.
Initial download of the metrics may take a while.