Fig. 26
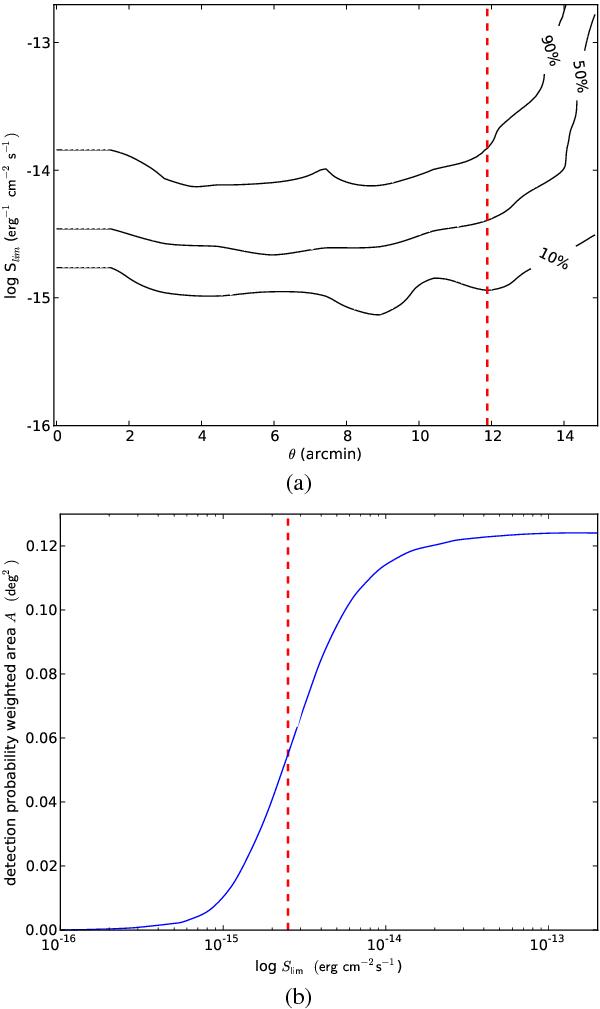
a) Survey completeness as a function of off-axis angle and limiting flux. The 10%, 50% and 90% levels are indicated. The dashed red line indicates the restriction put on the off-axis angle. b) Cumulatively sensitivity-weighted surface areas as a function of limiting flux, integrated over all off-axis angles. The short-dashed red line indicates the deduced limiting flux of 2.5 × 10⁻¹⁵ergcm-2 s-1 at which 50% completeness is reached as indicated in a).
Current usage metrics show cumulative count of Article Views (full-text article views including HTML views, PDF and ePub downloads, according to the available data) and Abstracts Views on Vision4Press platform.
Data correspond to usage on the plateform after 2015. The current usage metrics is available 48-96 hours after online publication and is updated daily on week days.
Initial download of the metrics may take a while.