Fig. 10
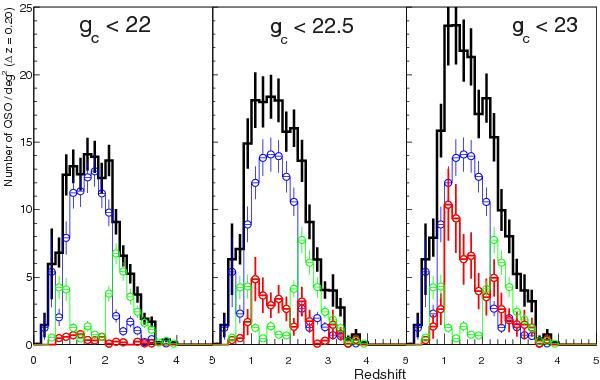
Quasar number counts per deg2 as a function of redshift (Δz = 0.2). Blue is for the new sample of quasars identified with our BOSS deep program, green for the previously known BOSS sample, red is for the MMT sample and black for the total. The blue, green and red curves use mutually exclusive samples and correspond to the zones defined in Sect. 4.3.
Current usage metrics show cumulative count of Article Views (full-text article views including HTML views, PDF and ePub downloads, according to the available data) and Abstracts Views on Vision4Press platform.
Data correspond to usage on the plateform after 2015. The current usage metrics is available 48-96 hours after online publication and is updated daily on week days.
Initial download of the metrics may take a while.