Fig. 4
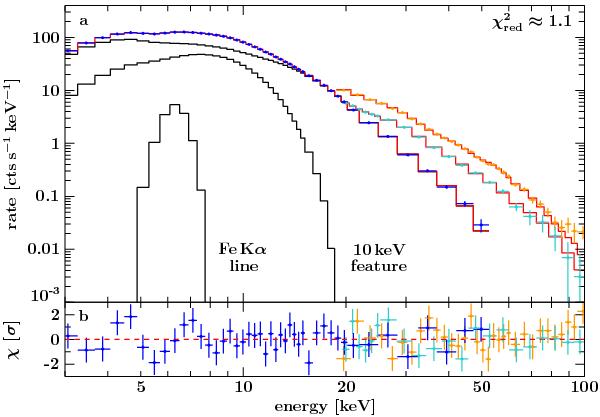
a) Folded spectrum from epoch 6 together with best fit (red) and all model components, i.e., CutoffPL, 10 keV feature, Fe Kα fluorescence line, and five cyclotron features. b) Residuals of the best fit, shown as the difference between the data and the model normalized to the uncertainty of each data point. Dark blue data points correspond to PCA, cyan points to HEXTE, and orange points to ISGRI.
Current usage metrics show cumulative count of Article Views (full-text article views including HTML views, PDF and ePub downloads, according to the available data) and Abstracts Views on Vision4Press platform.
Data correspond to usage on the plateform after 2015. The current usage metrics is available 48-96 hours after online publication and is updated daily on week days.
Initial download of the metrics may take a while.