Fig. 10
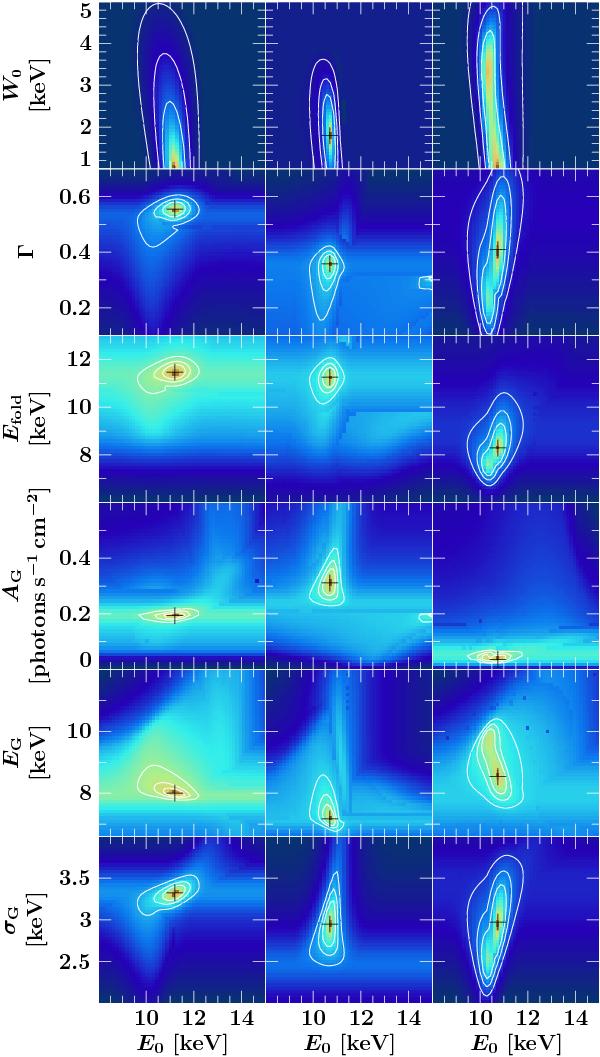
Confidence contours between the fundamental CRSF energy and other fit parameters. The columns show the results for epochs 2, 6, and 14, respectively. Contour lines correspond to the 68.3%, 90%, and 99% confidence level. Color indicates Δχ2 with respect to the best fit value, with the color scale running from orange (low Δχ2) to dark blue (large Δχ2).
Current usage metrics show cumulative count of Article Views (full-text article views including HTML views, PDF and ePub downloads, according to the available data) and Abstracts Views on Vision4Press platform.
Data correspond to usage on the plateform after 2015. The current usage metrics is available 48-96 hours after online publication and is updated daily on week days.
Initial download of the metrics may take a while.