Fig. 6
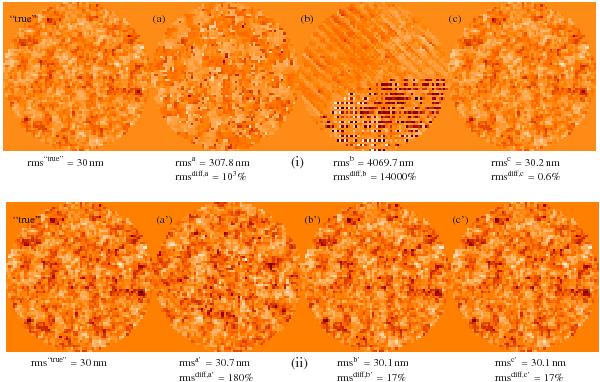
Choice of an appropriate starting point. Estimated upstream aberration maps with one spectral channel for three different starting points. [i] Without turbulent aberrations in the simulated images. [ii] With turbulent aberrations in the simulated images. From left to right, with a dynamic range adapted to the visualization: “true” simulated aberration map, (a) and (a’) estimated aberrations with a random aberration map (rms value of the simulated aberrations) as starting point, (b) and (b’) estimated aberrations with a zero aberration map as starting point, and (c) and (c’) estimated aberrations with a random aberration map (rms value 108 times lower than the “true” one) as starting point. The estimation is performed with a regularization on the star flux.
Current usage metrics show cumulative count of Article Views (full-text article views including HTML views, PDF and ePub downloads, according to the available data) and Abstracts Views on Vision4Press platform.
Data correspond to usage on the plateform after 2015. The current usage metrics is available 48-96 hours after online publication and is updated daily on week days.
Initial download of the metrics may take a while.