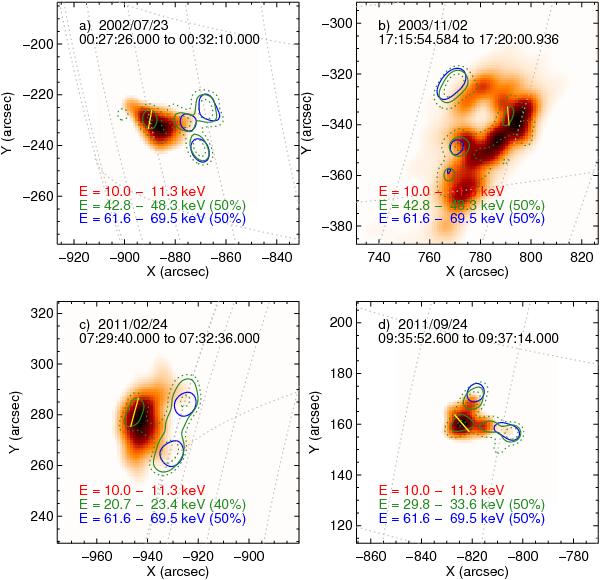
Fig. 6

CLEAN maps for the four flares, evidencing thermal emission at 10−11.3 keV (red), footpoints at 61.6−69.5 keV (blue contours, at 50% of the maximum of each map), and non-thermal looptop sources (green solid) at 42.8−48.3 keV (50%) for flares A and B, 20.7−23.4 keV (40%) for flare C, and 29.8−33.6 keV (50%) for flare D. The countour levels of 30% and 70% at those energies (green dashed lines) are also shown. The thick yellow line indicates the length L. Date and integration times are indicated in each map.
Current usage metrics show cumulative count of Article Views (full-text article views including HTML views, PDF and ePub downloads, according to the available data) and Abstracts Views on Vision4Press platform.
Data correspond to usage on the plateform after 2015. The current usage metrics is available 48-96 hours after online publication and is updated daily on week days.
Initial download of the metrics may take a while.


