Fig. 7
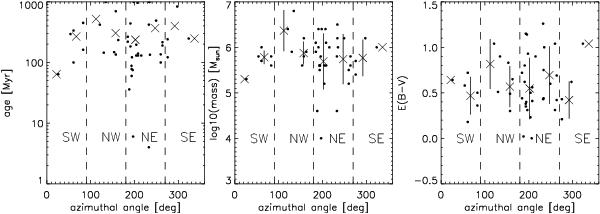
Results of the χ2 fitting. The four segments of the ring are indicated in the plots. From left to right are shown: stellar age, mass, and color excess of the cluster. The individual results are averaged every 45° (crosses), and the variance is indicated with the error bars. The angle starts at the southern point of the ring and is measured counter-clockwise.
Current usage metrics show cumulative count of Article Views (full-text article views including HTML views, PDF and ePub downloads, according to the available data) and Abstracts Views on Vision4Press platform.
Data correspond to usage on the plateform after 2015. The current usage metrics is available 48-96 hours after online publication and is updated daily on week days.
Initial download of the metrics may take a while.