Free Access
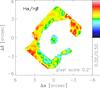
Fig. 5
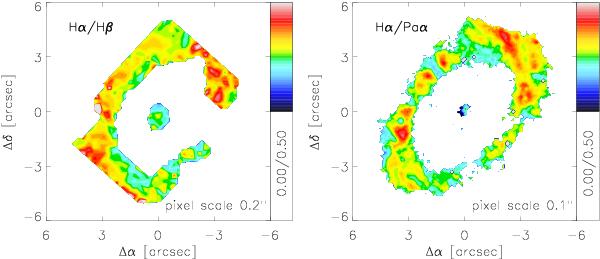
Left: color excess E(B − V) in the ring as measured from the Hα/Hβ line ratio using the OASIS line maps. Right: color excess in the ring as measured from the Hα/Paα line ratio using HST images. The pixel scales of each map are given in the lower right corner of each panel.
This figure is made of several images, please see below:
Current usage metrics show cumulative count of Article Views (full-text article views including HTML views, PDF and ePub downloads, according to the available data) and Abstracts Views on Vision4Press platform.
Data correspond to usage on the plateform after 2015. The current usage metrics is available 48-96 hours after online publication and is updated daily on week days.
Initial download of the metrics may take a while.