Fig. 3
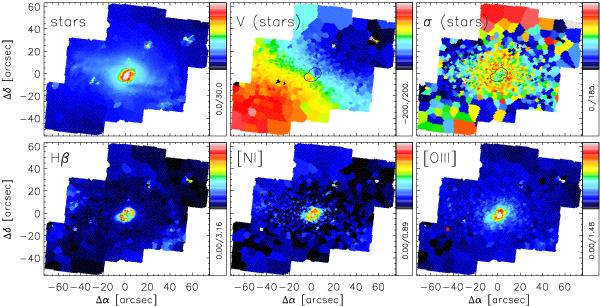
SAURON intensity maps of the stellar light (top left), Hβ (bottom left), [NI] (bottom middle), and [OIII] (bottom right) emission lines, as well as the stellar velocity field (top middle) and velocity dispersion map (top right). The color scale in each panel indicates the square of the intensity, or the velocity, the range of which is given below the color bar. The orientation of the maps is north up, east left. All positions are relative to the nucleus. To guide the eye, the contour corresponding to the central Hβ emission has been overplotted onto the velocity and velocity dispersion plots. The velocity range in the top-middle panel is [–200, 200] km s-1, the assumed systemic velocity of NGC 6951 is 1425 km s-1. The velocity dispersion range in the top-right panel is [0, 185] km s-1.
Current usage metrics show cumulative count of Article Views (full-text article views including HTML views, PDF and ePub downloads, according to the available data) and Abstracts Views on Vision4Press platform.
Data correspond to usage on the plateform after 2015. The current usage metrics is available 48-96 hours after online publication and is updated daily on week days.
Initial download of the metrics may take a while.