Fig. 2
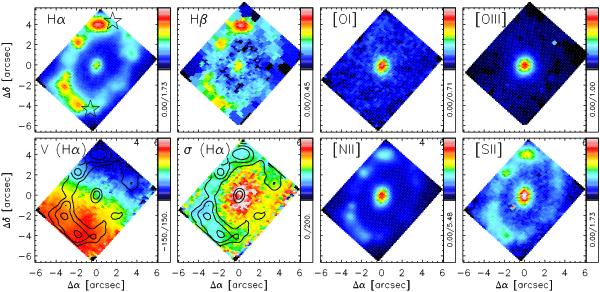
Top panels and bottom right: OASIS intensity maps of the emission lines Hα, Hβ, [OI], [OIII], [NII] and [SII]. The color scale in each panel indicates the square of the intensity, the range of which is given below the color bar. This scaling was chosen to emphasize faint structures in the maps. The “contact points”, discussed in the text, are indicated with a star in the Hα panel. Bottom left panels: the velocity and velocity dispersion map of Hα. The flux contours of the integrated Hα emission are overplotted for emphasis. The velocity range in the bottom left panel is [–150, 150] km s-1, with an assumed systemic velocity of NGC 6951 of 1425 km s-1. The velocity dispersion range in the adjacent panel is [0, 200] km s-1. The orientation of all maps is north up, east left. All positions are relative to the nucleus.
Current usage metrics show cumulative count of Article Views (full-text article views including HTML views, PDF and ePub downloads, according to the available data) and Abstracts Views on Vision4Press platform.
Data correspond to usage on the plateform after 2015. The current usage metrics is available 48-96 hours after online publication and is updated daily on week days.
Initial download of the metrics may take a while.