Fig. 6
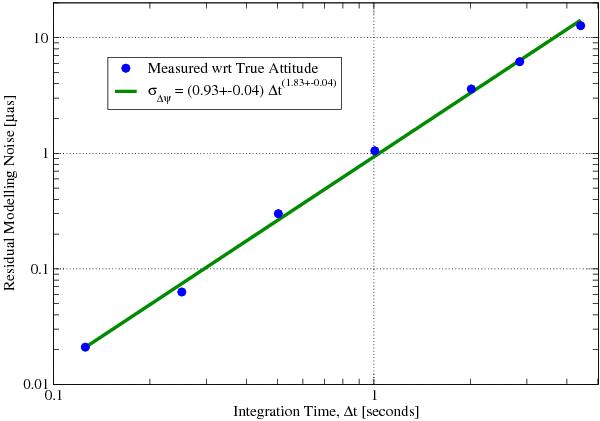
Standard deviation of the error angle between the effective attitude measured during a certain integration time and the physical attitude as a function of integration time. 6 h of simulation data were processed. This data is shown in Table 1. The residual error should increase approximately with the square of the integration time, according to Eq. (7). The actual power-law slope equals 1.83 ± 0.04.
Current usage metrics show cumulative count of Article Views (full-text article views including HTML views, PDF and ePub downloads, according to the available data) and Abstracts Views on Vision4Press platform.
Data correspond to usage on the plateform after 2015. The current usage metrics is available 48-96 hours after online publication and is updated daily on week days.
Initial download of the metrics may take a while.