Fig. 9
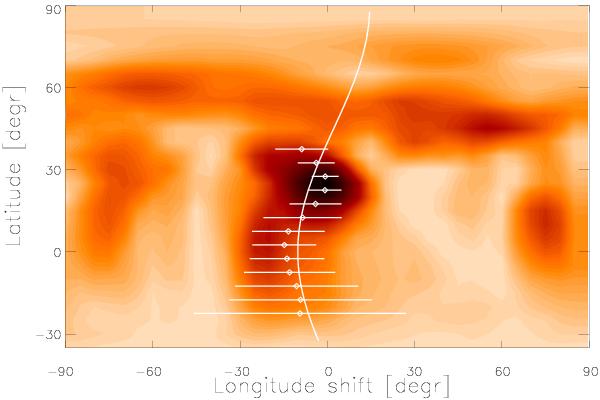
Cross-correlation function (CCF) map for DP CVn. The image is the average of four CCF maps obtained from cross-correlating the individual Doppler reconstructions (i.e., Ca i 6439 Å, Fe i 6430 Å, Fe i 6421 Å, and Fe i 6400 Å maps) taken in Apr. (ser1) and May (ser2). Dots with error bars are the Gaussian-fitted correlation peaks per 5° latitude bin. The best fit suggests an anti-solar differential rotation function (solid line) and corresponds to a surface shear α of − 0.035.
Current usage metrics show cumulative count of Article Views (full-text article views including HTML views, PDF and ePub downloads, according to the available data) and Abstracts Views on Vision4Press platform.
Data correspond to usage on the plateform after 2015. The current usage metrics is available 48-96 hours after online publication and is updated daily on week days.
Initial download of the metrics may take a while.